For many investors, the S&P 500 feels like a natural choice. It’s often described as ‘the market,’ and its recent performance has been undeniably strong. But is investing solely in the S&P 500 the best long term approach? Let’s take a closer look.
What is the S&P 500?
The S&P 500 Index measures the performance of 500 of the largest publicly traded companies in the United States. These are called “large cap” companies, meaning they have very high “market capitalizations”, a term used for businesses with the highest total stock value in the market (calculated by multiplying their stock price by the number of shares they’ve issued). Together, these companies represent roughly 80% of the total U.S. stock market value, which is why the S&P 500 is generally considered a useful proxy for the U.S. stock market. However, despite its coverage, the index excludes medium-sized and smaller companies, international stocks, bonds, and alternative investments like commodities and real estate. So while it gives
you a big piece of the U.S. economy, it leaves a lot of other markets and investable assets on the table.
What else is out there?
The global investment universe is much bigger than just large U.S. companies. Below is a quick guide through the other investable asset classes that are out there, as well as major indices that represent them:
How has the S&P 500 actually performed over time?
As shown above, the S&P 500 is just one piece of a complex and diverse global investment
picture. To understand how it stacks up against other options, we can look at the chart below,
which includes the returns of the S&P 500 as well as every other index mentioned in the
previous section:
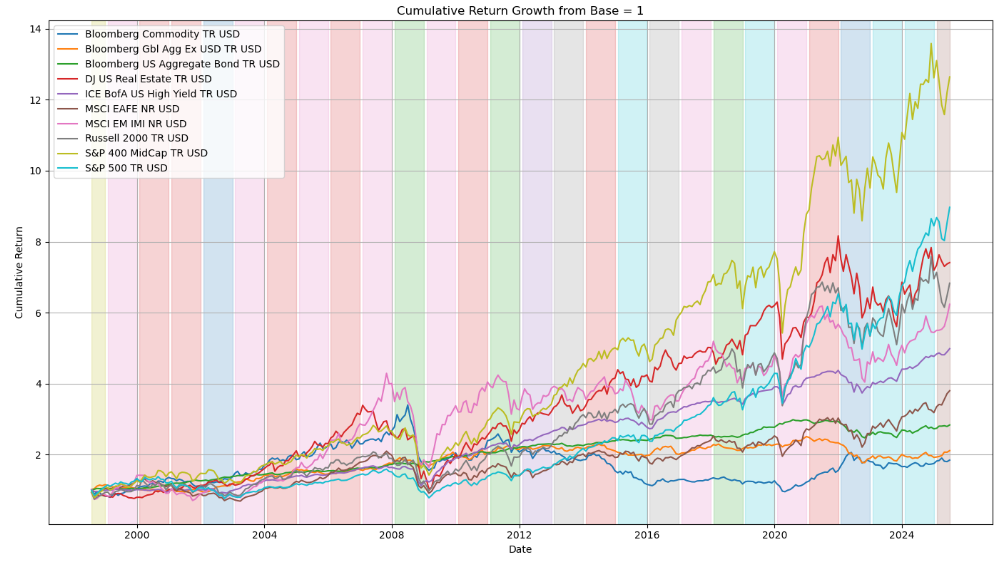
Despite its recent strong run, the S&P 500 hasn’t always been the star of the show. From the chart above, we can observe the following facts:
Even over very long periods, the S&P 500 hasn’t always dominated. The chart below shows the
performance of small cap vs. large cap stocks dating back to 1926:
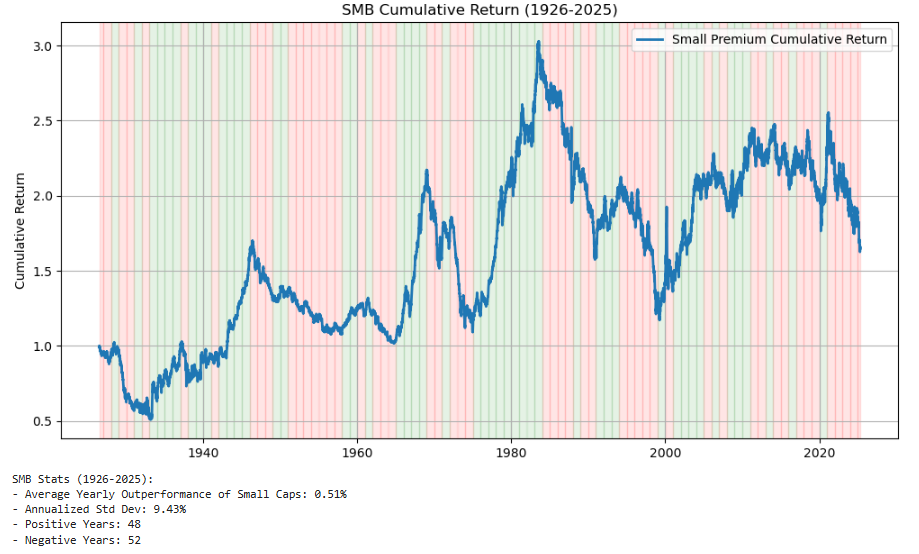
Raw data source: Morningstar. Indices used are for illustrative purposes only and are not investable. Past performance is not indicative of future results. All returns reflect total return performance, including reinvested dividends. Indexes represent broad asset class benchmarks and may not reflect the performance of actual investments.
Small companies have historically outperformed returns wise over the long run, despite large companies outperforming 52% of the calendar years on the chart.
This period includes multi decade stretches where the S&P 500 delivered flat or even negative
returns based on the index price, notably 1930–1950 (-1.16% return per year), 1962–1975
(-0.26% return per year), and 2000–2013(-0.15% return per year).
Why does everyone love the S&P 500 now?
Because recently, it’s been fantastic. Since 2013, the S&P 500, as tracked by the VOO ETF (a popular fund that mirrors the index), has delivered an annual total return (dividends included) of over 14%, significantly outpacing its historical average of about 11.05% compounded annual returns since 1970. That’s a tremendous performance, and it explains why so many portfolios have been tilted heavily, or entirely, towards this index.
So why not just the S&P 500?
There’s no denying it: the S&P 500 has been on an incredible run. From the start of 2013 through 2025 so far, it’s delivered an average annual price return of about 12.4%, which is well above its historical average of 8.8% from 1928 to 2012
That sounds extraordinary, and it is strong, but it’s not that far outside the range of what the S&P 500 has done before. Statistically speaking, it’s only about 0.21 standard deviations above its long-term average, which makes it an above average stretch, but not an outlier. That’s largely because the S&P 500 is a highly volatile investment. Some years deliver double digit gains, others double digit declines, making it riskier and less predictable than many realize. That kind of volatility isn’t suited for everyone, and it’s one more reason why relying solely on the S&P 500 may not be the best approach. When you have that kind of swing built into an investment, periods of strong performance like this aren’t as rare as they might seem.
Still, past success doesn’t guarantee future results. As we’ve shown, the S&P 500 hasn’t always been the best performer. In fact, there have been long stretches, including entire multi-decade periods, where the index had stagnant and even negative returns, falling behind other investments like real estate, small cap stocks, or emerging markets.
Relying solely on one group of U.S. large companies to carry your entire portfolio might have produced great results for a while, but that doesn’t make it the right long term strategy. It also means ignoring a much broader universe of opportunities. Markets move in cycles, what’s leading today can lag tomorrow, and that’s why diversification matters.
The S&P 500 can certainly be a strong foundation, but it’s not the whole picture. A well balanced portfolio, spread across different company sizes, regions, and types of investments, can help reduce risk by spreading it across areas that don’t always move in the same direction. This way, when one part of the market struggles, others may hold steady or even grow, helping you stay on track for long term success.
The bottom line: Diversifying for the long term
It’s easy to chase past performance, and hard to resist the S&P 500’s stellar recent run. But history shows that diversification is the more resilient strategy. No one knows exactly what the next decade will look like, but spreading your investments across multiple asset classes gives you more ways to win, and fewer ways to lose.
At rebel Financial, we help investors build well diversified portfolios tailored to their individual goals, preferences, and comfort with risk. If you’re wondering whether your portfolio may be too concentrated in the S&P 500, or if there’s room to better align it with your long term objectives and risk tolerance, we’re currently offering a complimentary portfolio review and personalized
risk analysis meeting to help you find out.
It’s completely free with no obligation, just an honest, professional review to help you validate your current approach or uncover new opportunities, helping you make confident decisions about your investments. To get started, simply visit the portfolio analysis page on our website by clicking on this link, where you can schedule your complimentary portfolio analysis meeting.
In our next article, we’ll explore the concept of “False Diversification”, the common situation where owning multiple funds gives the illusion of diversification, but in reality, results in overlapping or overly concentrated positions. We’ll also look at frequent mistakes even professionals make when trying to build diversified portfolios, and how to avoid them. Stay tuned!

Franco Iozzo
Disclaimer: The information contained on this blog is for informational and educational purposes only and should not be construed as professional financial advice. Investment decisions should be based on your individual circumstances and objectives. Before making any investment decisions, you should consult with a qualified financial advisor, tax advisor, and/or attorney to determine what may be best for your individual situation.