The first quarter of the new year has brought us small positive returns in many of the U.S. market indices, which means that investors survived—for now, at least—the worst start to a calendar year ever for the U.S. stock market.
The Wilshire 5000 Total Market Index–the broadest measure of U.S. stocks and bonds—was up 1.17% for the first three months of 2016, which is remarkable considering that the index was down more than 10% by the second week of February. The comparable Russell 3000 index has gained 0.97% so far this year.
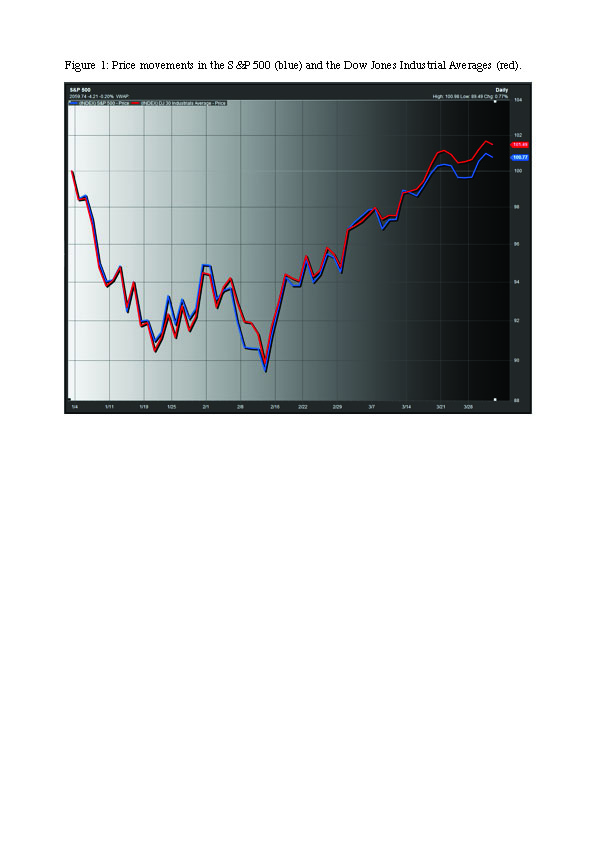
The Wilshire U.S. Large Cap index gained 1.25% in the first three months of 2016. The Russell 1000 large-cap index was up 1.17%, while the widely-quoted S&P 500 index of large company stocks posted a gain of 0.77% in the first quarter of the year.
The Wilshire U.S. Mid-Cap index gained 2.24% for the quarter. The Russell Midcap Index was also up 2.24%.
Small company stocks, as measured by the Wilshire U.S. Small-Cap index, gave investors a 0.85% return during the first three months of the year. The comparable Russell 2000 Small-Cap Index was down 1.52%, while the technology-heavy Nasdaq Composite Index lost 2.75% for the quarter.
Meanwhile, global markets are not off to a good start. The broad-based EAFE index of companies in developed foreign economies lost 3.74% in dollar terms in the first quarter of the year, in part because Far Eastern stocks were down 6.06%. In aggregate, European stocks lost 3.18%, and are now down more than 10% over the past 12 months. Emerging markets stocks of less developed countries, as represented by the EAFE EM index, fared better, gaining 5.37% for the quarter.
Looking over the other investment categories, real estate investments, as measured by the Wilshire U.S. REIT index, was up 5.20% for the first quarter. Commodities, as measured by the S&P GSCI index, gained 3.78% of their value in the first quarter, largely because of a modest 3.5% rise in oil prices since the end of last year.
Meanwhile, interest rates have continued their downward drift, leading to gains in bond portfolios. The Wilshire TUCS Fixed Income index returned 3.97% for the first quarter. The Bloomberg U.S. Corporate Bond Index returned 2.87% for the quarter, while the Bloomberg U.S. Treasury Bond Index rose 0.15%. Treasuries continue their long trend of paltry returns to investors; 3-month notes yielded 0.21% at the end of the quarter, while 12-month bonds were yielding just 0.60%. Go out to ten years, and you can get a 1.78% annual coupon yield.
The easy call at the beginning of the year would have been to bail out when the markets were declining and sit out the widely-predicted start of a painful, protracted bear market. Some analysts were talking openly about another 2008-9 drop in share prices. But 10% market declines are simply a part of the market’s normal turbulence, and anyone who spooks as soon as they see a month of bearish sentiment is likely to miss out on the subsequent gains. Since hitting their 2016 lows on February 11, both the S&P 500 index and the Nasdaq Composite have gained roughly 13% in value.
That doesn’t guarantee that there will be gains going forward, however. The Market Watch website reports that half of the S&P 500 sectors are reporting declines in earnings per share this quarter over the same period last year, and a poll by the FactSet analysts suggests that seven out of the ten sectors will end the earnings season reporting declining earnings.
Part of the wind at the backs of stocks this past six weeks has come, yet again, from the U.S. Federal Reserve Board, which had originally signaled that it planned to raise interest rates four times this year. After its most recent meeting, the Fed is projecting just two interest rate hikes this year, and Fed Chairwoman Janet Yellen has clearly indicated that the Fed will remain cautious about disrupting the markets or the economy as it unwinds its various QE initiatives.
Another tailwind was provided by the falling dollar. In the first three months of the year, the dollar’s value against a basket of six major currencies fell 4.2%. A weaker dollar makes U.S. exports more price-competitive against goods and services sold in other currencies, potentially leading to higher top-line revenues for companies that do business overseas.
Investors also seemed to take comfort that the Chinese stock market has stabilized—for now, at least. Recently, Chinese officials reported the first rise in an important manufacturing statistic—the purchasing managers index—in eight months.
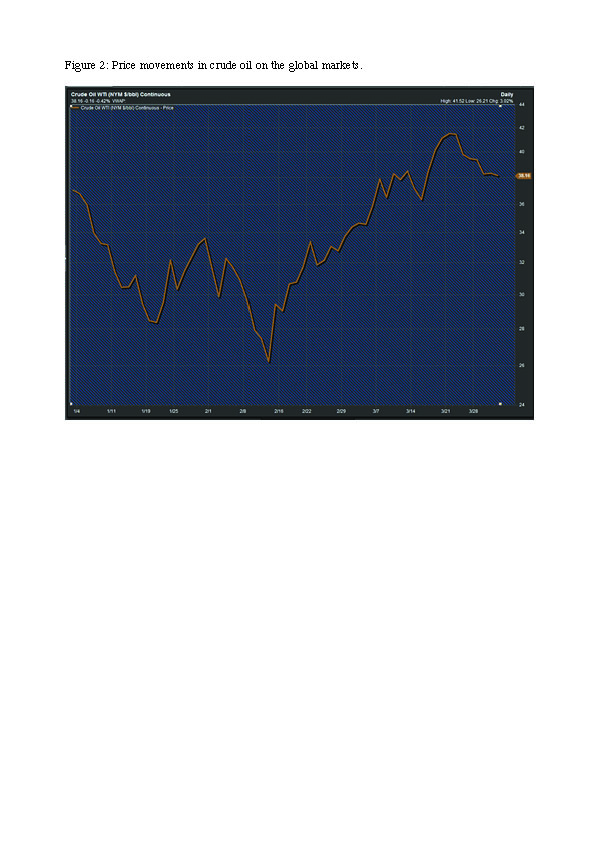
But arguably the biggest stabilizer of U.S. and global stock markets was the rise in oil—or, more precisely, the end of a long unnerving drop in the price of crude that caused anxiety to ripple through the investor community. Analysts are not sure how the price of a barrel of crude oil is connected with the value of stocks; indeed, for most companies, lower energy costs are a net plus to the bottom line. But investors seemed to take comfort in the fact that the price of the world’s most important commodity had stabilized. It’s worth noting that the day the stock market hit its low for the year—February 11—was also the day when oil futures hit their low of $26.21 a barrel.
You can easily compare the movements of oil and stock prices with the two accompanying charts, one showing the movements of the S&P 500 and the Dow Jones Industrial Averages, the other showing the price of a barrel of oil on the international markets. The two look identical in this market cycle. Eventually, that inexplicable link will be broken, but who knows when?
When that link does break, the market will turn back to reflecting the health of the U.S. and global economy. In the U.S., employment growth has remained strong, with 215,000 new jobs added in March, above predictions of 199,000. Overall, the economy has added millions of jobs in the last two years. Wage growth continues to be low—up 2.3% today over a year earlier—but while that’s discouraging for workers, companies (and their bottom lines, and eventually their stock values) are benefiting from relatively cheap labor. It’s worth noting that the Institute for Supply Management’s manufacturing index reflected growth for the first time since last August, suggesting that manufacturing activity is picking up in the U.S. economy.
Does that mean the market will go up? We can’t predict the future; indeed, even the present is hard to understand. Our mission as investors is to hang on and allow the millions of workers who get up every morning and go to work to do what they do best: incrementally, hour by hour, day by day, week by week, grow the value of the companies we own with their efforts. Investors will spook and sometimes flee stocks, driving their prices down, but for the long-term, the returns on your investments are invisibly, inexorably driven by the underlying value that is created in the offices, cubicles and factory floors all over the world.
This article was written for information purposes only and its content should not be construed by any consumer and/or prospective client as rebel Financial’s solicitation to affect, or attempt to affect transactions in securities, or the rendering of personalized investment advice for compensation. No client or prospective client should assume that any such discussion serves as the receipt of, or a substitute for, personalized advice from rebel Financial, or from any other investment professional. See our disclosures page for more information.
Phil Ratcliff, President of rebel Financial, is a senior financial advisor that holds an AIF®, CFP®, ChFC®, and CLU® certifications. He started his career at American Express Financial Advisors in 2003, then moved to AXA Advisors for 7 years before founding rebel Financial LLC in 2013.

 The first quarter of the new year has brought us small positive returns in many of the U.S. market indices, which means that investors survived—for now, at least—the worst start to a calendar year ever for the U.S. stock market.